Harmony collects comprehensible data and organizes and contextualizes it in a clear way.
Identify & Measure Metrics
1
Determine endorsed factors, identify metrics and available data
Each metric is comprised of a collection of data points. Harmony enhances data credibility and reliability through data triangulation, consolidating hundreds of metrics from diverse sources and presenting them in structured issues for a more user-friendly, and trustworthy insights.
Structure and Clean Data
2
Collect, clean and normalize data
Harmony’s data engineering team aggregates and cleanses diverse data sources to construct a single dataset. From here, proprietary algorithms standardize and normalize raw data into comparable metrics.
Build Profiles
3
Predict unreported values and contextualize metrics
Analyze all metrics for all companies
Harmony analyzes and measures all metrics for each company against a universe of 11,000 companies, sector and industry peers.
Build profiles at the company, product, and portfolio levels
Building company, product, and portfolio profiles enables uniform benchmark comparisons.
Connect with Companies
4
Promote disclosure, encourage data review, and understand targets
Through our collaborative approach and emphasis on data quality, stakeholders can work together to increase reporting transparency and develop effective strategies to manage risks.
Through Harmony’s portal, companies and managers can:
View, enter, or refine the data in their profile
Compare against peers and the Harmony Universe
Build an action plan and monitor progress toward set targets
Mandatory Disclosures: an Imperative Across 83% of the World’s GDP
Select a country to view their reporting mandates.
Tailored Solutions
Analyze
Harmony identifies the relative risk of your portfolio and gives you the tools to explore your position and make decisions about strategies, managers, and holdings.
Report
Harmony aggregates your data into a downloadable report to give your stakeholders a clear understanding of how your goals are being fulfilled.
Connect
Harmony’s platform allows you to connect with managers and companies around metrics that matter to you.
Benchmark
Harmony contextualizes your company’s metrics relative to your peers and the broader investment space.
Set Targets
Harmony’s platform allows you to set goals and communicate these targets to stakeholders.
Report
Harmony aggregates your data and makes it available to stakeholders to simplify the reporting of metrics and goals.
SUPPORTED FRAMEWORKS
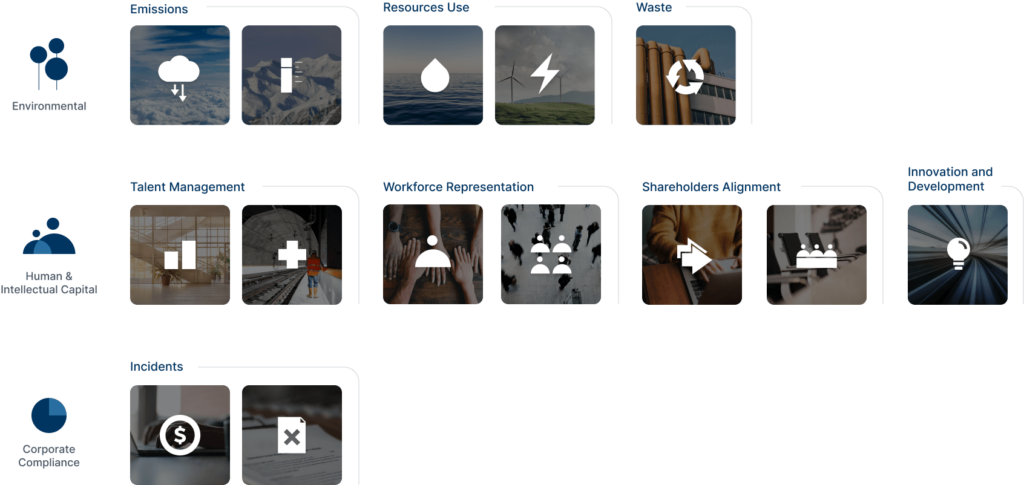
Harmony maps metrics across multiple frameworks, including GRI, SDG, WFE, TCFD, CDP, SFDR, and SASB, to ensure we monitor and measure relevant issues. Harmony defines relevant issues as quantitative measures that represent the interests and concerns of a material number of stakeholders, such as employees, customers, regulators and communities.
Interested in partnering with us?
Get in touch and learn about Harmony’s partnership program.